Bookmark and Share

20 Highest Yielding Dividend Contenders

Attached you can find the 20 higest yielding Dividend Contenders. The table is a screenshot from the Dividend Champions Financial Factsheet Excel Table.


Ticker Company Market Cap P/E Fwd P/E P/S P/B Dividend
ETP Energy Transfer Partners, L.P. 20.42B - 13.18 0.7 0.78 12.62%
BPL Buckeye Partners, L.P. 6.68B 13.62 12.25 1.83 1.46 9.98%
OHI Omega Healthcare Investors, Inc. 5.45B 59.74 16.96 6 1.53 9.67%
APU AmeriGas Partners, L.P. 3.90B 30.6 15.41 1.52 5.33 9.00%
HEP Holly Energy Partners, L.P. 1.95B 14.42 15.85 4.28 6.92 8.53%
TLP Transmontaigne Partners L.P. 602.54M 15.07 11.57 3.38 1.89 8.36%
TCP TC PipeLines, LP 3.48B 15.89 14.36 8.25 3.75 7.96%
WES Western Gas Partners, LP 7.09B 37.13 15.95 3.16 2.19 7.80%
VGR Vector Group Ltd. 2.79B 55.74 26.65 1.54 - 7.70%
ETE Energy Transfer Equity, L.P. 16.45B - 7.81 0.41 - 7.69%
SEP Spectra Energy Partners, LP 12.78B 11.46 13.27 6.55 1.13 7.08%
EPD Enterprise Products Partners L.P. 54.51B 19.69 15.73 1.86 2.49 6.53%
WPC W. P. Carey Inc. 6.58B 24.91 26.44 7.75 2.09 6.53%
ENB Enbridge Inc. 55.53B 25.09 16.98 1.61 1.39 6.35%
SCG SCANA Corporation 5.86B - 12.87 1.33 1.06 6.28%
SKT Tanger Factory Outlet Centers, Inc. 2.14B 29.49 20.33 4.39 3.53 6.24%
OMI Owens & Minor, Inc. 1.04B 27.68 7.78 0.11 1.01 6.06%
PPL PPL Corporation 19.43B 13.15 11.4 2.61 1.78 5.91%
NHI National Health Investors, Inc. 2.83B 17.61 17.13 10.15 2.15 5.86%
MMP Magellan Midstream Partners, L.P. 14.68B 16.9 14.69 5.85 6.9 5.72%

This is only a small part of the full Dividend Champions/Contenders Financial Factsheet Excel table. The full excel sheet contains all essential financial ratios from all 113 Dividend Champions (over 25 years of constant dividend growth) and 204 Dividend Contenders (10 to 24 years of consecutive dividend growth). It's an open version, so you can work with it very easily.


These are the content ratios:


Ticker
Company
Market Cap
P/E
Fwd P/E
P/S
P/B
Dividend Yield
Payout Ratio
EPS next 5Y
Sales past 5Y
EPS Q/Q
Sales Q/Q
ROA
ROE
ROI
Debt/Equity
Operating Margin
Performance Year
Beta
Price
Target Price


If you like to receive the full excel, just make a small donation to keep this work and blog alive. After you made the donation, we send you the Excel file to your donation e-mail adress. Thank you!

If you like to receive the excel each week, just click on donation on a regular basis.

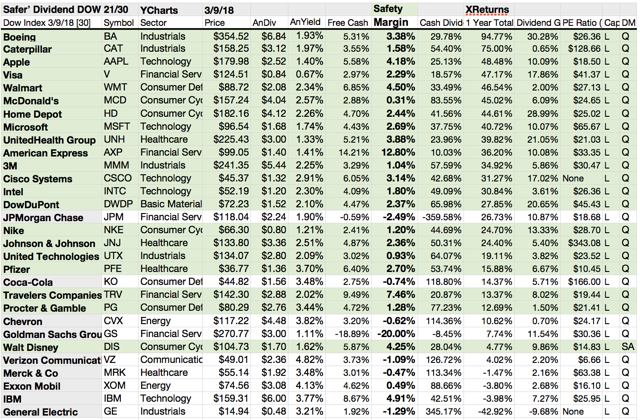
Dow Jones Stocks With A Big Safety Margin


Best German Dividend Paying Stocks


This is only a small part of the full Foreign Yield Fact BookIf you like to receive the full book each week with all fresh yields, just make a small donation to keep this work and blog alive. After you made the donation, we send you the pdf book to your donation e-mail adress. Thank you!


20 Dividend Champions With The Highest EPS Growth Predictions

Attached you can find a list of the 20 Best Dividend Champions by expected 5-Year EPS growth. Each of the stocks has a double digit growth ratio. The table is a screenshot from the Dividend Champions Financial Factsheet Excel Table.


Ticker Company Fwd P/E P/S P/B Dividend EPS next 5Y
CVX Chevron Corporation 18.55 1.6 1.49 3.84% 51.20%
FUL H.B. Fuller Company 13.76 1.19 2.63 1.10% 26.47%
MCY Mercury General Corporation 15.64 0.75 1.47 5.33% 25.30%
EV Eaton Vance Corp. 15.05 4.2 6.41 2.14% 23.03%
SHW The Sherwin-Williams Company 19.02 2.5 10.49 0.65% 18.48%
MSA MSA Safety Incorporated 17.96 2.58 5.33 1.68% 18.00%
XOM Exxon Mobil Corporation 16.06 1.35 1.71 4.09% 17.29%
LOW Lowe's Companies, Inc. 14.23 1.06 12.69 1.87% 16.62%
UMBF UMB Financial Corporation 15.65 6.15 1.74 1.51% 16.40%
CSL Carlisle Companies Incorporated 15.52 1.63 2.64 1.37% 16.00%
PH Parker-Hannifin Corporation 15.95 1.82 4.4 1.45% 15.83%
TROW T. Rowe Price Group, Inc. 15.44 5.8 4.88 2.39% 15.60%
NUE Nucor Corporation 12.66 1.07 2.47 2.25% 15.43%
BMI Badger Meter, Inc. 27.88 3.51 5.21 1.05% 15.30%
GRC The Gorman-Rupp Company 19.36 1.92 2.31 1.73% 15.00%
TNC Tennant Company 24.93 1.27 4.3 1.17% 15.00%
AOS A. O. Smith Corporation 22.97 3.69 6.91 1.09% 15.00%
SPGI S&P Global Inc. 20.69 8.22 69.99 1.02% 14.93%
SYY Sysco Corporation 17.28 0.55 13.91 2.38% 14.78%
WST West Pharmaceutical Services, Inc. 27.96 4.27 5.33 0.61% 14.10%


This is only a small part of the full Dividend Champions Financial Factsheet Excel table. The full excel sheet contains all essential financial ratios from all 113 Dividend Chamions. It's an open version, so you can work with it very easily.

These are the content ratios:


Ticker
Company
Market Cap
P/E
Fwd P/E
P/S
P/B
Dividend Yield
Payout Ratio
EPS next 5Y
Sales past 5Y
EPS Q/Q
Sales Q/Q
ROA
ROE
ROI
Debt/Equity
Operating Margin
Performance Year
Beta
Price
Target Price


If you like to receive the full excel, just make a small donation to keep this work and blog alive. After you made the donation, we send you the Excel file to your donation e-mail adress. Thank you!


If you like to receive the excel each week, just click on donation on a regular basis.

100 Best Yielding Canada Dividend Stocks


This is only a small part of the full Foreign Yield Fact BookIf you like to receive the full book each week with all dividend fresh yields, just make a small donation to keep this work and blog alive. After you made the donation, we send you the pdf book to your donation e-mail adress. Thank you!